|
External Packages (page 37 of 38) |
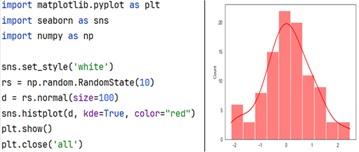
We can use seaborn to construct histograms to visualize distributions using the seaborn histplot function. A few of the important arguments are:
1) data, which is typically a numpy array, pandas series, or pandas dataframe containing the data, 2) x, which specifies the column in the data to use for the histogram, 3) y, which specifies the column in the data to use for the histogram when you want to create a bivariate histogram, 4) bins, which specifies the number of bins to use when dividing the data into intervals for plotting, and 5) kde, which controls whether to display a kernel density estimate (KDE) of the data in addition to the histogram.