
 |
External Packages (page 36 of 38) |
A correlation heatmap is a graphical representation of a correlation matrix, where each cell in the matrix is colored according to the correlation value between two continuous variables. Seaborn has a heatmap function to easily create a heatmap based on a correlation matrix contained in a pandas data frame.
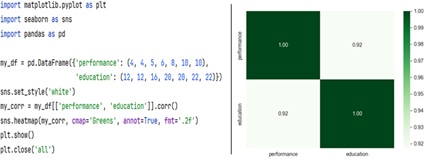
We can customize our seaborn heatmap using the following arguments: 1) vmin and vmax to set the min and max colormap values for the colormap, 2) center to center the colormap at a specific value, 3) linewidths and linecolor to set the width and color of the lines that divide each cell, and 4) cbar to draw (or not draw) a colorbar.