|
External Packages (page 38 of 38) |
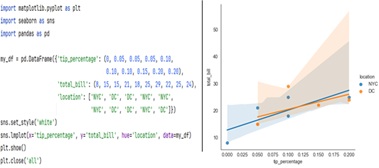
We can use seaborn to visualize a linear regression model between two variables using the seaborn lmplot function. It visualizes a line representing a linear regression model along with data points on the 2D space and x and y can be set as the horizontal and vertical labels respectively.
We can use the order argument to specify a polynomial regression (e.g., order=2 for squared polynomial or order=3 for a cubed polynomial). We can also use the logistic argument if our y variable is binary (e.g., logistic=True).