|
External Packages (page 32 of 38) |
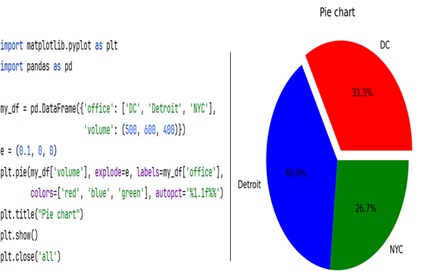
Here is an example of a pie chart using pandas Series as our data inputs. Pie charts display data as slices of a pie, where each slice represents a percentage of the whole. Matplotlib gives us many different formatting options with pie charts. The below example displays a few of them.