|
External Packages (page 33 of 38) |
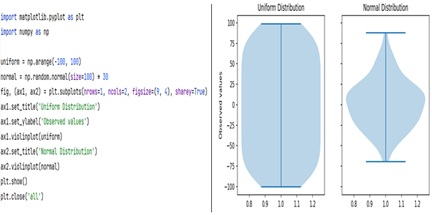
Here is an example of a violin plot using simulated data using numpy arrays as our data inputs.
Violin plots are used to visualize the distribution of numerical data, providing insights into data density, variability, and comparisons between multiple groups. Violin plots combine the features of box plots and density plots, allowing for a comprehensive view of the data distribution. Notice how this matplotlib example uses subplots, which makes the code a bit more complicated.