|
External Packages (page 30 of 38) |
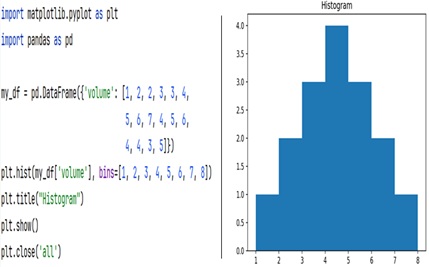
Here is an example of a histogram that uses a pandas Series for the data. Histograms are used to represent data in the form of groups or bins, showing the frequency of data points within each bin. They can be useful to determine if data are normally distributed. A base histogram in matplotlib takes only a single Series of data.