|
External Packages (page 29 of 38) |
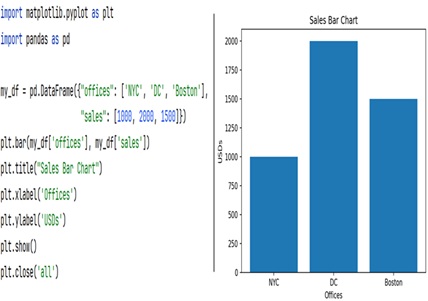
Here is an example of a bar graph that uses pandas Series for the data for the x and y axes. Bar charts represent data with rectangular bars, where the length or height of each bar is proportional to the values they represent.