Daniel J. Eisenstein
Institute for Advanced Study, Olden Lane, Princeton, NJ 08540
and
Emory F. Bunn
Physics and Astronomy Department, Bates College, Lewiston, ME 04240
A recent Letter [1] claims to have discovered evidence for birefringence in the propagation of radio waves across cosmological distances. Unfortunately, this claim is based on a flawed statistical analysis.
To search for birefringence, the authors look for correlations between
the direction and distance to a galaxy and the angle ![]() between the
polarization direction and the galaxy's major axis.
Plotting the data as shown in Fig. 1(d) of their paper, here
reproduced as Fig. 1, they use the correlation coefficient
between the
polarization direction and the galaxy's major axis.
Plotting the data as shown in Fig. 1(d) of their paper, here
reproduced as Fig. 1, they use the correlation coefficient ![]() as their statistic.
as their statistic.
To estimate the significance of their result, the authors use mock data
samples constructed by randomly picking the angle ![]() from a uniform
distribution of allowed angles.
from a uniform
distribution of allowed angles. This is not the proper null hypothesis
for testing the dependence of
This is not the proper null hypothesis
for testing the dependence of ![]() on the direction and distance
to the galaxies. Rather, for the null hypothesis, one should draw the
angles from the observed distribution, which in the case of the
high-redshift subsample, from which the primary conclusions were drawn,
clearly is not a uniform distribution. From Fig. 1, one can see by
eye that the polarization in these galaxies tends to align with the
galaxy minor axis, i.e.
on the direction and distance
to the galaxies. Rather, for the null hypothesis, one should draw the
angles from the observed distribution, which in the case of the
high-redshift subsample, from which the primary conclusions were drawn,
clearly is not a uniform distribution. From Fig. 1, one can see by
eye that the polarization in these galaxies tends to align with the
galaxy minor axis, i.e. ![]() prefers
prefers ![]() and avoids 0
or
and avoids 0
or ![]() . For example,
. For example, ![]() of the points have
of the points have
![]() .
.
That this matters can be easily seen from the following example.
Consider the region in the x-y coordinate plane spanning -1 to 1 in
both directions. If we uniformly fill the first and third quadrants,
the correlation coefficient ![]() will be 0.75. If, however, we fix
will be 0.75. If, however, we fix
![]() while allowing x to span -1 to 1 uniformly as
before, then
while allowing x to span -1 to 1 uniformly as
before, then ![]() . Collapsing the y
direction in this way allows more of the scatter to be explained by
the best-fit line.
. Collapsing the y
direction in this way allows more of the scatter to be explained by
the best-fit line.
Hence, we should expect that the tendency of the angle ![]() to
prefer
to
prefer ![]() will cause
will cause ![]() to be higher than it would be if
to be higher than it would be if
![]() were uniformly distributed between 0 and
were uniformly distributed between 0 and ![]() . By using
the latter as their null hypothesis, the authors find a spuriously high
statistical significance for their result. Indeed, if the underlying
galaxy population truly had a uniform intrinsic distribution of
. By using
the latter as their null hypothesis, the authors find a spuriously high
statistical significance for their result. Indeed, if the underlying
galaxy population truly had a uniform intrinsic distribution of
![]() , it would be impossible to measure the proposed birefringence
at all; one could not detect a rotation of such a distribution.
, it would be impossible to measure the proposed birefringence
at all; one could not detect a rotation of such a distribution.
Stated another way and estimating by eye, in Fig. 1 the data
are more tightly correlated than they would be if the ![]() values were randomly and uniformly distributed between 0 and
values were randomly and uniformly distributed between 0 and ![]() . However, they are not significantly more correlated than they
would be if the
. However, they are not significantly more correlated than they
would be if the ![]() values in a quadrant were shuffled among
themselves while the best-fit line was adjusted accordingly. Hence,
the claimed correlation of the angle
values in a quadrant were shuffled among
themselves while the best-fit line was adjusted accordingly. Hence,
the claimed correlation of the angle ![]() with the position and
distance of the galaxy is not statistically significant.
with the position and
distance of the galaxy is not statistically significant.
Taking the null hypothesis that the birefringence does not exist and that
the angles between the polarization directions and galaxies' major axes
are distributed as the data indicate, one is left to explain why the
particular direction in the sky turned out to yield a higher ![]() than other directions. This most likely results from combining the
inhomogeneous sky coverage--the sample is mostly from the Northern sky
and avoids low galactic latitudes--and the propensity of the chosen
statistic
than other directions. This most likely results from combining the
inhomogeneous sky coverage--the sample is mostly from the Northern sky
and avoids low galactic latitudes--and the propensity of the chosen
statistic ![]() to prefer directions that place many galaxies near
the center of the spread in
to prefer directions that place many galaxies near
the center of the spread in ![]() where the tendency of
where the tendency of
![]() to prefer the center of its range can best reduce the scatter.
It is not surprising that such a direction could exist.
to prefer the center of its range can best reduce the scatter.
It is not surprising that such a direction could exist.
A second error relating to the choice of statistic and null hypothesis
is the authors' use of the slope of the best fit line in Fig. 1
as a measure of the inverse birefringence scale ![]() .
Because the null hypothesis (either the one they used or the one proposed
here) produces a non-zero slope in the absence of birefringence, this
is clearly a highly biased and inappropriate estimator.
.
Because the null hypothesis (either the one they used or the one proposed
here) produces a non-zero slope in the absence of birefringence, this
is clearly a highly biased and inappropriate estimator.
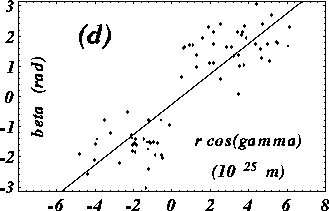
Figure 1: Figure 1(d) reproduced from [1].
71 galaxies with redshifts above 0.3 are shown. ![]() is the angle from the proposed birefringence direction, r is the
distance to the galaxy, and
is the angle from the proposed birefringence direction, r is the
distance to the galaxy, and ![]() is the angle between the galactic
major axis and the polarization direction. See [1] for more details.
Our claim is that the
is the angle between the galactic
major axis and the polarization direction. See [1] for more details.
Our claim is that the ![]() are not uniformly distributed between 0
and
are not uniformly distributed between 0
and ![]() but rather are clumped toward
but rather are clumped toward ![]() .
.
D.J.E. was supported by NSF PHY-9513835.