Over the past five years or so, a bunch of data have poured in that
bear on the value of ![]() . They can be crudely summarized by
saying that
. They can be crudely summarized by
saying that ![]() has been measured to be
has been measured to be
|
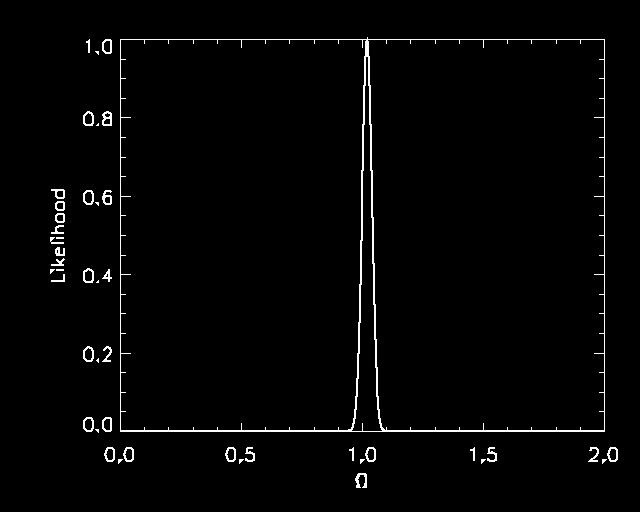
The likelihood function, by definition, is the probability density of
getting the data that we actually observed, as a function of the value
of ![]() . In other words, when we say that the likelihood function
peaks at
. In other words, when we say that the likelihood function
peaks at ![]() , we mean that this value of
, we mean that this value of ![]() is the
best fit to the data. In a Universe with
is the
best fit to the data. In a Universe with ![]() , the data that
we actually observed are quite plausible. In a Universe with
, the data that
we actually observed are quite plausible. In a Universe with ![]() (where the likelihood is extremely small), the data that we
actually observed would have been quite unlikely to occur.
(where the likelihood is extremely small), the data that we
actually observed would have been quite unlikely to occur.
Now we're ready to state Bayes's theorem and apply it to
the situation at hand. Bayes's theorem says that the posterior
probability density is the product of the prior probability density
and the likelihood function (times a constant):
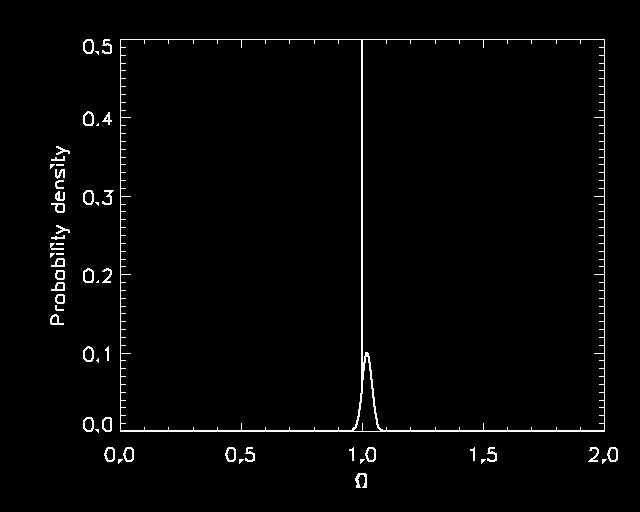
If we take the prior shown in Figure 1 and multiply it by the likelihood
function shown in Figure 2, we get the posterior probability density
shown in Figure 3. Over the relatively small range of ![]() 's where
the likelihood function was significantly different from zero (say
0.94-1.10 or so), the prior was essentially a constant plus that
narrow delta-function
spike at
's where
the likelihood function was significantly different from zero (say
0.94-1.10 or so), the prior was essentially a constant plus that
narrow delta-function
spike at ![]() . That means that the posterior probability
will be just a bump shaped like the likelihood function plus
a delta-function spike as shown.
. That means that the posterior probability
will be just a bump shaped like the likelihood function plus
a delta-function spike as shown.
|
You can work out what fraction of the total probability (that is,
of the integral of the probability density) lies under the delta-function
spike. For the prior shown in Figure 1, the answer turns out to be 99.5%.
In other words, the data changed me from a 15% believer in ![]() to someone who things there are 200-to-1 odds in favor of
to someone who things there are 200-to-1 odds in favor of ![]() .
.
It's perhaps of interest to know how much those numbers depend on the
details of the prior. Let's assume that a person's prior consists of
a delta-function spike at ![]() , plus some smooth function of
, plus some smooth function of
![]() , and let's assume that the smooth bit can be taken to be
constant in the region where the likelihood is significant
(i.e., within a few standard deviations of
, and let's assume that the smooth bit can be taken to be
constant in the region where the likelihood is significant
(i.e., within a few standard deviations of ![]() ).
Then the prior can be characterized by two numbers:
).
Then the prior can be characterized by two numbers: ![]() , the prior
probability
of inflation (the area under the narrow spike at
, the prior
probability
of inflation (the area under the narrow spike at ![]() ) and
) and
![]() , the ``background'' level in the vicinity.
For example, my prior as shown in Figure 1 is characterized by
, the ``background'' level in the vicinity.
For example, my prior as shown in Figure 1 is characterized by
![]() =0.15 and
=0.15 and
![]() =0.01.
=0.01.
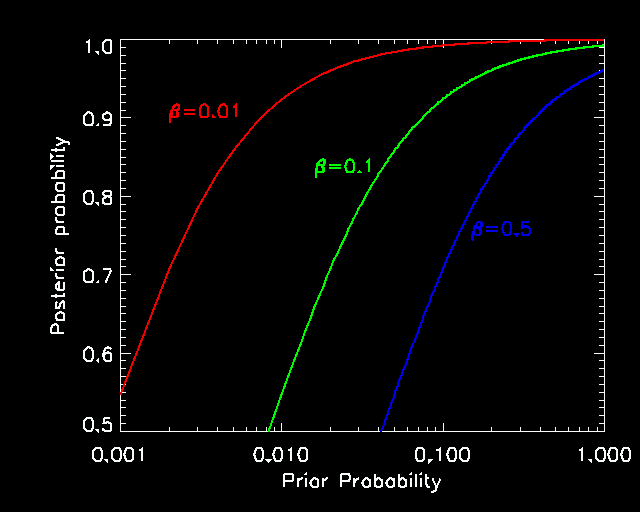
Figure 4
shows the posterior probability that ![]() as a function
of
as a function
of ![]() (the prior probability that
(the prior probability that ![]() ), for a few different
values of
), for a few different
values of ![]() . I would argue that
. I would argue that ![]() is about as large
as one would be likely to find.2
is about as large
as one would be likely to find.2
|
This shows that, quite generically, people who thought there was
any significant probability of ![]() before the recent data
rolled in should by now have very high assessments of the probability
that
before the recent data
rolled in should by now have very high assessments of the probability
that ![]() .
.
Unless, of course, one simply disbelieves the data. The recent data come from several different experiments, using different techniques and probing different aspects of the Universe, and they all agree with each other. For that reason, I think that the current data are quite robust. Anyway, my purpose at the moment is not to convince you that you should believe the data, but simply to show how the posterior probabilities come out if you do believe the data.