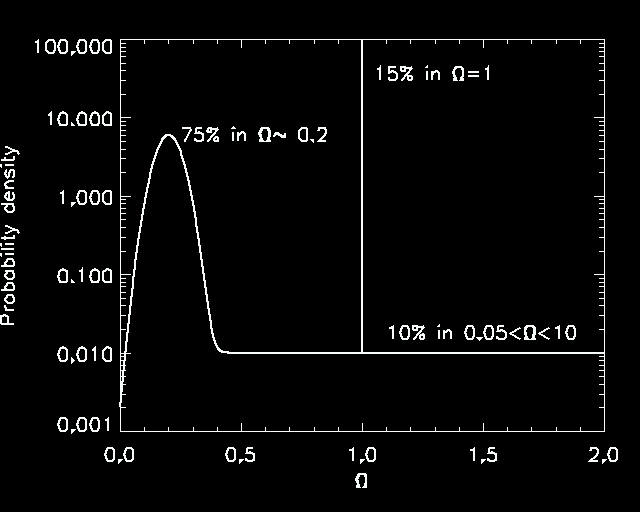
Figure 1 shows a cartoonish representation of my own personal prior
probability density for ![]() , circa 1998. In case you don't know,
the ``units'' of a probability density are probability per unit
value of the parameter. The integral of the probability
density from
, circa 1998. In case you don't know,
the ``units'' of a probability density are probability per unit
value of the parameter. The integral of the probability
density from ![]() to
to ![]() gives the probability that the parameter's
true value is in the interval from
gives the probability that the parameter's
true value is in the interval from ![]() to
to ![]() . The probability
density must integrate to 1 over the entire possible
range of parameters (which is 0 to infinity for
. The probability
density must integrate to 1 over the entire possible
range of parameters (which is 0 to infinity for ![]() ).
).
|
At that time, as
I recall, I was fairly skeptical
about inflation (compared to many other cosmologists). I estimate that at the time I thought there
was about a 15% chance that inflation happened. That means
that 15% of the total integral lies in a narrow (delta-function-like)
spike at ![]() .
.
At that time, the balance of other evidence (leaving aside arguments
in favor of inflation) tended to suggest that in fact ![]() was
about 0.2 with large uncertainties. That's why my prior has a large
bump at
was
about 0.2 with large uncertainties. That's why my prior has a large
bump at ![]() .
.
But the possibility was wide open that we were missing
something important in our observation or interpretation of the data,
so there was a finite probability that neither of the above possibilities
was right. In that case, ![]() could be just about anything. That's
the reason for the flat portion of the probability density.
could be just about anything. That's
the reason for the flat portion of the probability density.
Let me emphasize that the details of this plot are very imprecise:
I just cobbled together a crude model of what I think my opinions
were at the time. The qualitative features are about right,
but the exact values of the two key features that are going to
matter later, namely the amount of probability in the ![]() spike
and the more-or-less flat background in the neighborhood of
spike
and the more-or-less flat background in the neighborhood of ![]() ,
could be significantly different.
,
could be significantly different.