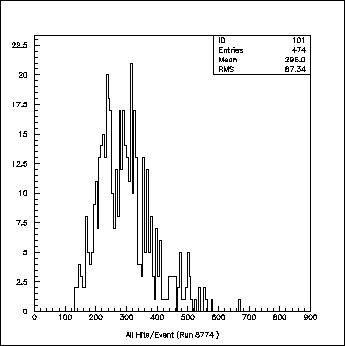
As of today (12/30/98) online recsis has been modified to pass results to the time histories data base. For example, in online recsis a histogram is filled with the number of hits per event in those events with tracks. An example is shown below.
Notice the centroid is about 296 hits with a width of about 87 hits. This result is roughly consistent with what I see on the web-based interface at JLAB when extracting the most recent table entry (I get the same 290 +/- 90 hits from the table). However, when I go to view a plot of the time history of the centroid (and width) of the hits per event (currently misnamed as hits per track) I get the following results.
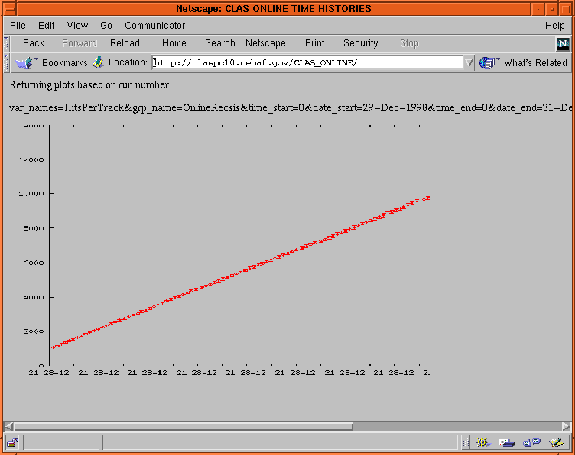
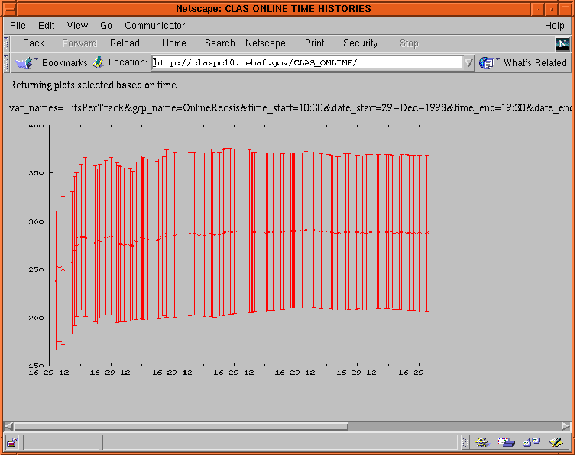
The points should be roughly constant at 290 +/- 90 hits which is clearly not what the plot shows. The input to this plot had a very wide time range time including an upper time limit a couple if days in the future. In the course of fiddling I narrowed the time range down to something within hours of the known times and get a plot that appears to be correct.
It may be that having too large a time range confusing the data base search somehow???
I have also seen the following error message intermittently when I'm running online recsis. The indented sentence is my own debugging message.
RECS_BRUN  L: Run was created at: 10:13:55 on Mon the 16th of Feb  1998
update_tables SQL_ERR 0: connection errorBad handshake
 Update db with run   8774 at event   5373 after   11
update_tables SQL_ERR 0: connection errorBad handshake
 Update db with run   8774 at event   12983 after   22